Market Outlook
November 27, 2017
Market Cues
Domestic Indices
Chg (%)
(Pts)
(Close)
Indian markets are likely to open negative tracking global indices and SGX Nifty.
BSE Sensex
0.3
91
33,679
US equities rose on Friday as investors placed bets on a strong holiday shopping
Nifty
0.4
41
10,390
season and that corporate tax cuts would keep the current economic expansion
Mid Cap
0.6
98
16,934
going. The S&P 500 hit record highs, rising 0.2 percent to 2,602 with information
Small Cap
0.4
81
18,025
technology as the best-performing sector. The Nasdaq composite climbed
0.3
Bankex
0.1
31
29,221
percent to 6,889, posting intraday and closing records while the Dow Jones
industrial average rose 32 points to finish at 23,558.
Global Indices
Chg (%)
(Pts)
(Close)
The FTSE 100 closed down 0.1% at 7,410 points after ending flat on Thursday.
British shares on Friday ended Black Friday just slightly lower, with Paddy Power
Dow Jones
0.1
32
23,558
leading winners against a strong pound, which was poised to rise for a third
Nasdaq
0.3
22
6,889
consecutive week amid growing hopes that Brexit talks could bear fruits next month.
FTSE
(0.1)
(8)
7,410
Nikkei
0.1
28
22,551
Indian stock markets on Friday closed with gains for the seventh straight day, helped
by gains in IT stocks. The 30-share BSE Sensex finished at 33,679, a three week
Hang Seng
0.5
158
29,866
high and the Nifty closed a 10 points short of 10,400. Consumer durables and IT
Shanghai Com
0.1
2
3,354
stocks turned out to be big movers.
Advances / Declines
BSE
NSE
News Analysis
Advances
1,523
1,034
S&P maintains India ratings at 'BBB-', says outlook stable
Declines
1,238
731
Detailed analysis on Pg2
Unchanged
155
65
Investor’s Ready Reckoner
Key Domestic & Global Indicators
Volumes (` Cr)
Stock Watch: Latest investment recommendations on 150+ stocks
BSE
4,489
Refer Pg5 onwards
NSE
28,831
Top Picks
CMP
Target
Upside
Net Inflows (` Cr)
Net
Mtd
Ytd
Company
Sector
Rating
(`)
(`)
(%)
FII
(243)
15,133
53,585
Blue Star
Capital Goods
Buy
701
867
23.8
MFs
2,326
3,825
99,236
Dewan Housing Finance
Financials
Accumulate
618
712
15.2
Asian Granito
Other
Buy
493
570
15.7
Navkar Corporation
Other
Buy
191
265
39.0
Top Gainers
Price (`)
Chg (%)
KEI Industries
Capital Goods Accumulate
339
380
12.3
Tv18Brdcst
51
9.7
More Top Picks on Pg4
Gmrinfra
19
9.4
Key Upcoming Events
Fretail
643
8.7
Previous
Consensus
Date
Region
Event Description
Sintex
25
6.3
Reading
Expectations
Crompton
263
6.1
Nov27
US
New home sales
667.00
623.50
Nov28
US
Consumer Confidence
125.90
123.50
Nov29
US
GDP Qoq (Annualised)
3.00
3.20
Top Losers
Price (`)
Chg (%)
Nov29
Euro Zone Euro-Zone Consumer Confidence
0.10
0.10
Oberoirlty
492
(4.0)
Nov30
US
Initial Jobless claims
239.00
Welspunind
74
(3.2)
More Events on Pg7
Pvr
1,305
(3.2)
Rtnpower
9
(2.7)
Denabank
25
(2.7)
As on November, 24 2017
Market Outlook
November 27, 2017
News Analysis
S&P maintains India ratings at 'BBB-', says outlook stable
S&P Global Ratings has reaffirmed India’s sovereign rating and maintained the
stable outlook on Friday Evening. This is contradicting Moody’s Investor Service,
which upgraded the India sovereign credit rating earlier this month. The rating was
kept at BBB-/A-3 with a stable outlook, with S&P saying it reflected India’s strong
GDP growth and improving monetary credibility. The country remains at the lowest
investment grade, even as Moody’s action raised it one notch above. The move
could disappoint investors, who have pushed the Indian markets on hopes of
rating upgrade by S&P.
Economic and Political News
All revised I-T returns post demonetisation under lens
Fewer GST slabs possible in future, says CEA Subramanian
CBDT asks I-T dept to impose 'higher tax rate' on fraudulently revised ITRs
Buoyed by PSB recap plan, FPIs infuse $2.6 bn into Indian stocks this month
Corporate News
Solar stocks to gain big as India plans mega China-scale tenders
Aurobindo Pharma looks for inorganic growth prospects in East Europe
L&T's Hyderabad Metro project delay ups cost by over 30 per cent
End of road for 'cheapest car': Dealers stop placing orders for Tata Nano
Incentivize vehicles meeting BS-VI norms before Apr 2020: Mercedes to govt.
Hindustan Unilever to lower prices of some products on GST cut
Market Outlook
November 27, 2017
Top Picks HHHHH
Market Cap
CMP
Target
Upside
Company
Rationale
(` Cr)
(`)
(`)
(%)
Strong growth in domestic business due to its leade`hip
in acute therapeutic segment. Alkem expects to launch
Alkem Laboratories
23,652
1,978
2,125
7.4
more products in USA, which bodes for its international
business.
We expect the company would report strong profitability
Asian Granito
1,482
493
570
15.7
owing to better product mix, higher B2C sales and
amalgamation synergy.
Favorable outlook for the AC industry to augur well for
Cooling products business which is out pacing the
Blue Star
6,714
701
867
23.8
market growth. EMPPAC division's profitability to
improve once operating environment turns around.
With a focus on the low and medium income (LMI)
consumer segment, the company has increased its
Dewan Housing Finance
19,389
618
712
15.2
presence in tier-II & III cities where the growth
opportunity is immense.
Loan growth is likely to pick up after a sluggish FY17.
Lower credit cost will help in strong bottom-line growth.
Karur Vysya Bank
7,288
121
180
49.3
Increasing share of CASA will help in NIM
improvement.
High order book execution in EPC segment, rising B2C
KEI Industries
2,653
339
380
12.3
sales and higher exports to boost the revenues and
profitability
Expected to benefit from the lower capex requirement
Music Broadcast
2,145
376
434
15.4
and 15 year long radio broadcast licensing.
Massive capacity expansion along with rail advantage
Navkar Corporation
2,869
191
265
39.0
at ICD as well CFS augur well for the company
Strong brands and distribution network would boost
Siyaram Silk Mills
2,742
585
650
11.1
growth going ahead. Stock currently trades at an
inexpensive valuation.
Market leadership in Hindi news genre and no.
2
viewership ranking in English news genre, exit from the
TV Today Network
2,304
386
435
12.6
radio business, and anticipated growth in ad spends by
corporate to benefit the stock.
After GST, the company is expected to see higher
volumes along with improving product mix. The Gujarat
Maruti Suzuki
2,56,397
8,488
9,489
11.8
plant will also enable higher operating leverage which
will be margin accretive.
We expect loan book to grow at 24.3% over next two
GIC Housing
2,290
425
655
54.0
year; change in borrowing mix will help in NIM
improvement..
We expect sales/PAT to grow at 13.5%/20% over next
LT Foods
1845
69
96
39
two years on the back of strong distribution network &
addition of new products in portfolio.
Source: Company, Angel Research
Market Outlook
November 27, 2017
Key Upcoming Events
Result Calendar
Date
Company
November 14, 2017
Tata Global, JK Tyre, CEAT, Jyoti Structures, Bank of Baroda, Reliance Capital, Corporation Bank, MOIL
November 15, 2017
Automotive Axle
Source: Bloomberg, Angel Research
Global economic events release calendar
Bloomberg Data
Date
Time
Country
Event Description
Unit
Period
Last Reported
Estimated
Nov 27, 2017
8:30 PMUS
New home sales
Thousands
Oct
667.00
623.50
Nov 28, 2017
8:30 PMUS
Consumer Confidence
S.A./ 1985=100
Nov
125.90
123.50
Nov 29, 2017
7:00 PMUS
GDP Qoq (Annualised)
% Change
3Q S
3.00
3.20
3:30 PMEuro Zone Euro-Zone Consumer Confidence
Value
Nov F
0.10
0.10
Nov 30, 2017
7:00 PMUS
Initial Jobless claims
Thousands
Nov 25
239.00
2:25 PMGermany PMI Manufacturing
Value
Nov F
62.50
62.50
2:25 PMGermany Unemployment change (000's)
Thousands
Nov
(11.00)
(10.00)
Dec 01, 2017
6:30 AMChina
PMI Manufacturing
Value
Nov
51.60
51.50
3:00 PMUK
PMI Manufacturing
Value
Nov
56.30
56.50
Dec 05, 2017
2:25 PMGermany PMI Services
Value
Nov F
54.90
3:30 PMEuro Zone Euro-Zone GDP s.a. (QoQ)
% Change
3Q F
0.60
Dec 06, 2017
2:30 PMIndia
RBI Reverse Repo rate
%
Dec 6
5.75
5.75
2:30 PMIndia
RBI Repo rate
%
Dec 6
6.00
6.00
2:30 PMIndia
RBI Cash Reserve ratio
%
Dec 6
4.00
4.00
Dec 08, 2017
3:00 PMUK
Industrial Production (YoY)
% Change
Oct
2.50
Source: Bloomberg, Angel Research
Market Outlook
November 27, 2017
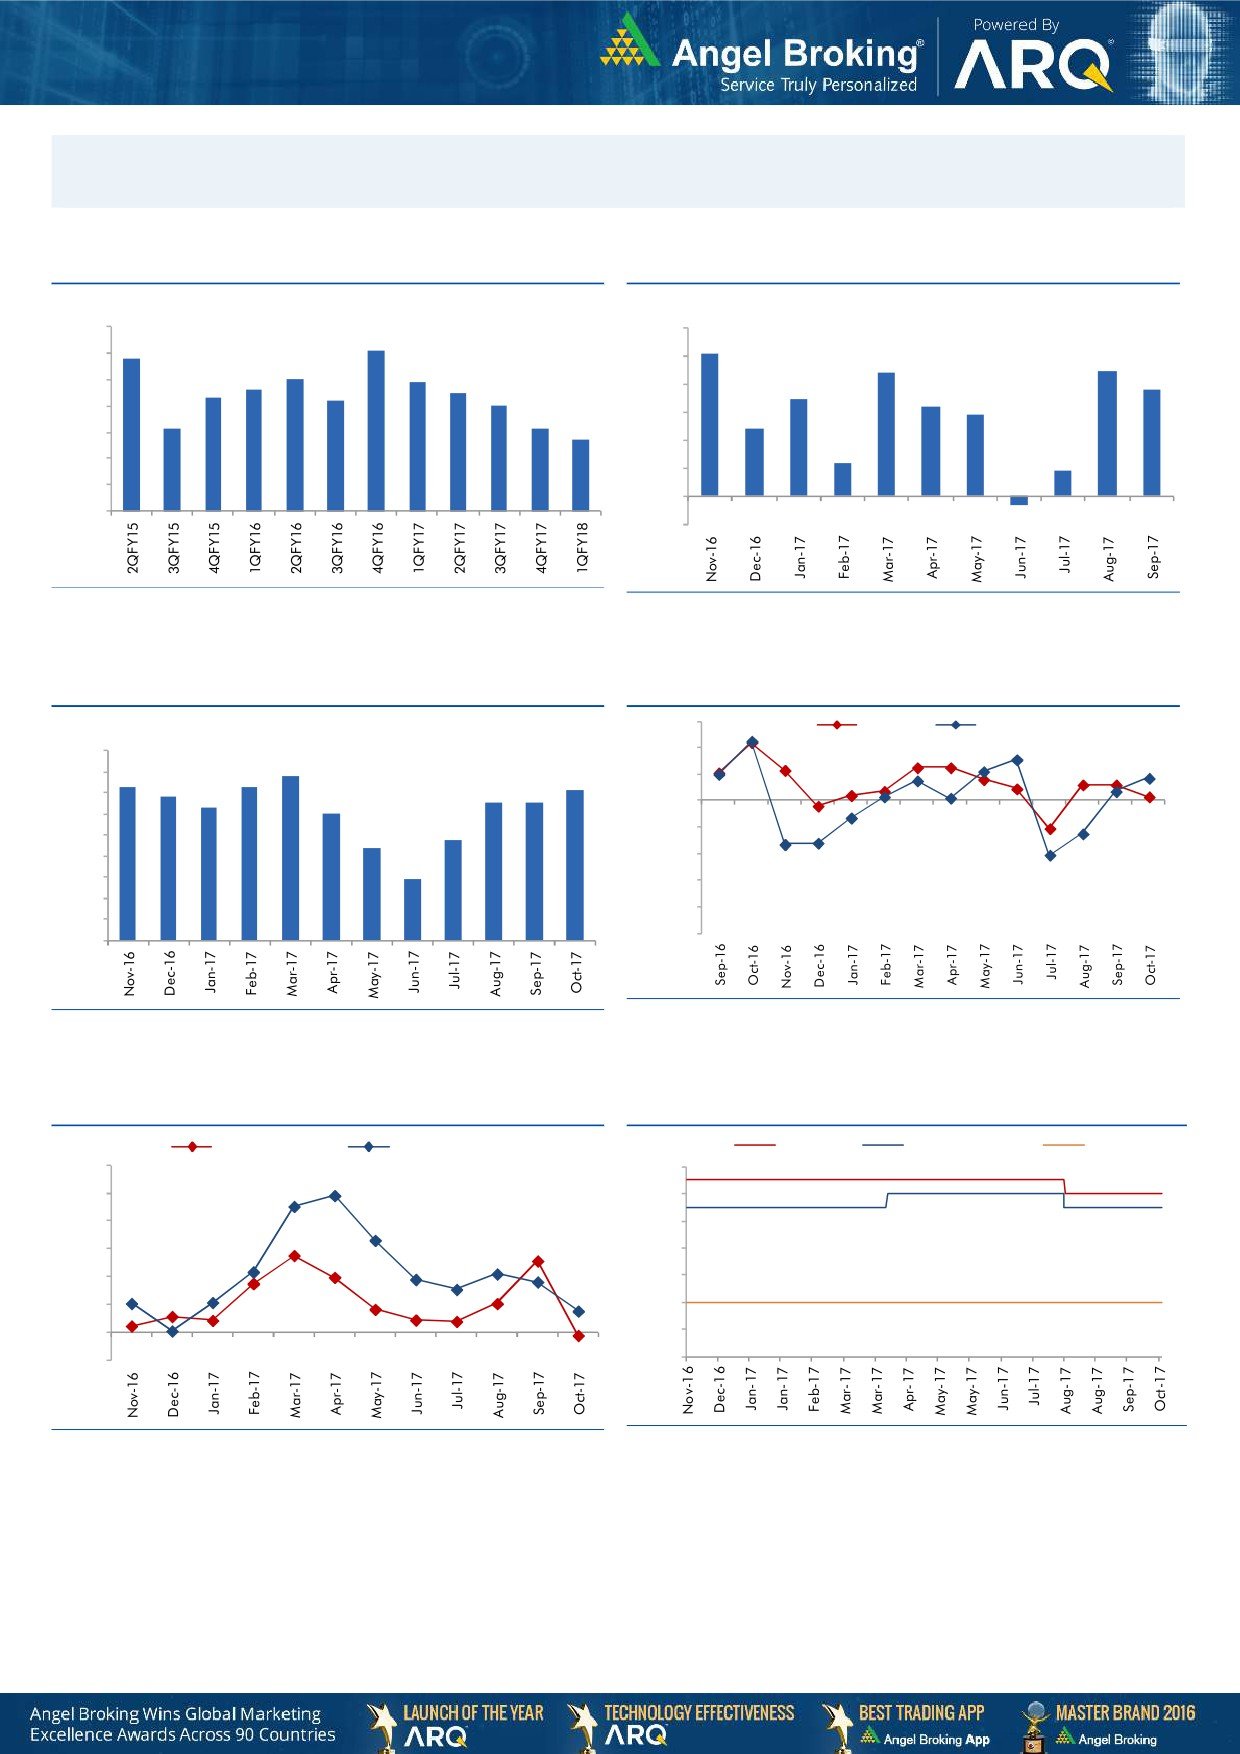
Macro watch
Exhibit 1: Quarterly GDP trends
Exhibit 2: IIP trends
(%)
(%)
10.0
6.0
9.1
5.1
8.8
9.0
5.0
4.4
4.5
8.0
7.9
7.6
7.5
3.8
8.0
7.3
3.5
7.2
7.0
4.0
3.2
2.9
7.0
6.1
6.1
3.0
2.4
5.7
6.0
2.0
1.2
5.0
0.9
1.0
4.0
-
3.0
(1.0)
(0.3)
Source: CSO, Angel Research
Source: MOSPI, Angel Research
Exhibit 3: Monthly CPI inflation trends
Exhibit 4: Manufacturing and services PMI
56.0
Mfg. PMI
Services PMI
(%)
4.5
54.0
3.9
4.0
3.6
3.7
3.6
52.0
3.4
3.2
3.3
3.3
3.5
3.0
50.0
3.0
2.4
48.0
2.5
2.2
2.0
46.0
1.5
1.5
44.0
1.0
42.0
0.5
40.0
-
Source: Market, Angel Research; Note: Level above 50 indicates expansion
Source: MOSPI, Angel Research
Exhibit 5: Exports and imports growth trends
Exhibit 6: Key policy rates
(%)
Exports yoy growth
Imports yoy growth
(%)
Repo rate
Reverse Repo rate
CRR
60.0
6.50
50.0
6.00
40.0
5.50
30.0
5.00
20.0
4.50
10.0
4.00
0.0
3.50
(10.0)
3.00
Source: Bloomberg, Angel Research
Source: RBI, Angel Research
Market Outlook
November 27, 2017
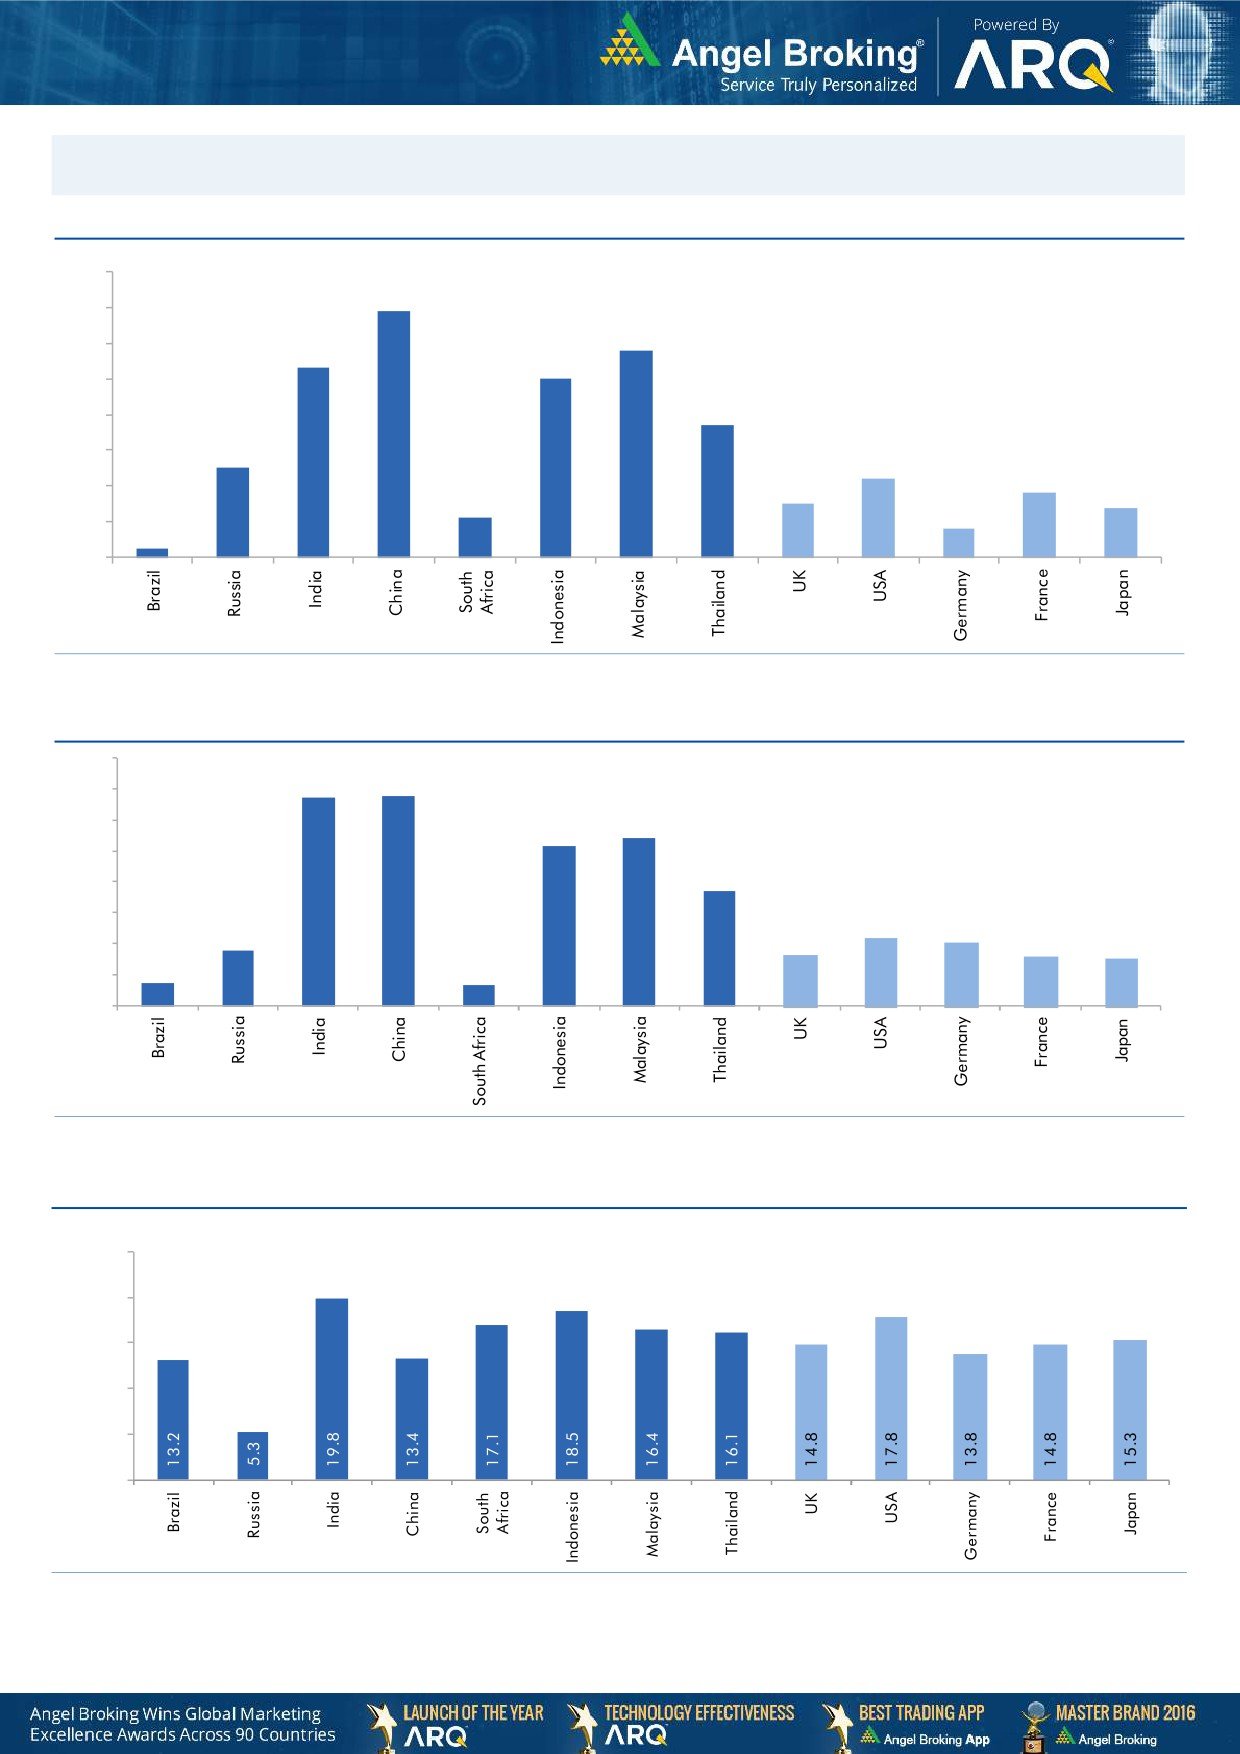
Global watch
Exhibit 1: Latest quarterly GDP Growth (%, yoy) across select developing and developed countries
(%)
8.0
6.9
7.0
5.8
6.0
5.3
5.0
5.0
1.1
3.7
4.0
2.5
3.0
2.2
1.8
2.0
1.5
1.4
0.8
1.0
0.3
-
Source: Bloomberg, Angel Research
Exhibit 2: 2017 GDP Growth projection by IMF (%, yoy) across select developing and developed countries
(%)
6.7
6.8
7.0
6.0
5.4
5.2
5.0
3.7
4.0
3.0
1.8
2.2
2.0
1.7
1.6
2.0
0.7
1.5
0.7
1.0
-
Source: IMF, Angel Research
Exhibit 3: One year forward P-E ratio across select developing and developed countries
(x)
25.0
20.0
15.0
10.0
5.0
-
Source: IMF, Angel Research
Market Outlook
November 27, 2017
Exhibit 4: Relative performance of indices across globe
Returns (%)
Country
Name of index
Closing price
1M
3M
1YR
Brazil
Bovespa
74,487
(2.4)
8.4
24.2
Russia
Micex
2,149
4.6
8.9
2.9
India
Nifty
10,349
0.9
5.5
29.3
China
Shanghai Composite
3,352
(1.3)
2.0
4.6
South Africa
Top 40
53,996
4.4
7.9
21.5
Mexico
Mexbol
48,136
(3.7)
(6.1)
6.1
Indonesia
LQ45
1,016
2.3
3.6
10.6
Malaysia
KLCI
1,721
(0.9)
(3.1)
5.6
Thailand
SET 50
1,090
0.1
8.2
18.1
USA
Dow Jones
23,526
1.1
7.9
23.3
UK
FTSE
7,417
(1.5)
0.1
8.4
Japan
Nikkei
22,523
5.0
16.1
26.1
Germany
DAX
13,009
0.2
7.0
22.7
France
CAC
5,380
0.4
6.2
19.2
Source: Bloomberg, Angel Research p68in4
Stock Watch
November 27, 2017
Company Name
Reco
CMP
Target
Mkt Cap
Sales ( Čcr )
OPM(%)
EPS (Č)
PER(x)
P/BV(x)
RoE(%)
EV/Sales(x)
(Č)
Price ( Č)
( Č cr )
FY18E FY19E
FY18E
FY19E
FY18E
FY19E
FY18E
FY19E
FY18E
FY19E
FY18E
FY19E
FY18E
FY19E
Agri / Agri Chemical
Rallis
Reduce
230
209
4,466
1,873
2,099
15.0
15.0
9.5
10.5
24.2
21.9
3.7
3.3
15.8
16.0
2.3
2.1
United Phosphorus
Accumulate
743
820
37,784
18,922
21,949
18.0
18.5
36.2
45.6
20.5
16.3
4.3
3.6
22.7
23.8
2.2
1.8
Auto & Auto Ancillary
Ashok Leyland
Accumulate
118
127
34,657
23,339
27,240
10.1
10.8
4.7
6.2
25.5
19.1
5.1
4.5
20.0
23.6
1.4
1.2
Bajaj Auto
Neutral
3,293
-
95,291
23,936
27,955
19.5
20.1
142.7
167.3
23.1
19.7
5.0
4.5
21.8
22.8
3.6
3.0
Bharat Forge
Buy
700
875
32,584
7,637
8,755
21.7
23.2
36.1
47.3
19.4
14.8
3.5
3.0
18.5
20.8
4.1
3.5
Eicher Motors
Neutral
30,808
-
83,868
19,043
22,837
19.5
19.9
835.4
1,019.0
36.9
30.2
13.8
10.6
40.9
37.8
4.3
3.5
Gabriel India
Neutral
188
-
2,694
1,782
2,033
9.7
10.2
7.1
8.9
26.4
21.2
5.3
4.5
21.0
22.2
1.5
1.3
Hero Motocorp
Accumulate
3,655
4,129
72,986
32,239
36,878
16.0
15.6
184.4
206.5
19.8
17.7
6.2
5.5
31.3
30.7
2.0
1.8
Jamna Auto Industries Neutral
66
-
2,620
1,441
1,662
14.4
14.8
13.9
17.6
4.7
3.7
1.3
1.1
30.0
31.0
1.8
1.5
Mahindra and Mahindra Neutral
1,435
-
89,180
46,971
53,816
13.6
14.0
67.7
79.8
21.2
18.0
3.0
2.7
15.0
15.9
1.8
1.5
Maruti
Accumulate
8,488
9,489
256,397
79,470
95,208
15.9
17.2
281.7
363.8
30.1
23.3
6.6
5.3
21.7
22.8
2.9
2.3
Minda Industries
Neutral
1,147
-
9,916
4,328
5,084
11.0
11.9
27.3
36.4
42.1
31.5
8.9
7.0
23.1
25.6
2.4
2.0
Motherson Sumi
Neutral
346
-
72,786
55,937
64,445
10.8
11.4
16.9
21.1
20.5
16.4
4.6
4.7
25.2
25.4
1.4
1.1
Tata Motors
Neutral
425
-
122,698
303,167
343,649
11.8
13.8
33.1
54.7
12.8
7.8
2.1
1.7
16.9
23.0
0.5
0.4
TVS Motor
Neutral
739
-
35,123
13,992
16,216
9.0
9.4
17.1
20.3
43.4
36.4
11.5
8.9
29.7
27.7
2.4
2.1
Amara Raja Batteries
Accumulate
790
858
13,498
6,140
7,122
14.3
15.6
29.3
39.0
27.0
20.3
4.6
3.9
17.1
19.0
2.2
1.9
Exide Industries
Neutral
207
-
17,574
8,689
9,854
15.1
15.2
9.7
11.0
21.4
18.8
3.8
3.4
15.7
16.1
1.8
1.5
Apollo Tyres
Neutral
253
-
14,496
15,739
17,326
13.3
14.6
20.4
26.7
12.4
9.5
1.5
1.3
20.4
26.7
1.1
1.0
Ceat
Neutral
1,821
-
7,366
6,661
7,717
11.1
14.2
116.2
178.2
15.7
10.2
2.7
2.3
15.2
21.3
1.2
1.0
JK Tyres
Neutral
145
-
3,284
8,318
9,239
16.2
16.4
21.0
27.5
6.9
5.3
1.3
1.1
19.1
20.4
0.8
0.7
Swaraj Engines
Neutral
1,973
-
2,451
788
889
16.4
16.5
71.6
81.0
27.6
24.4
7.9
7.4
29.6
31.0
2.8
2.4
Subros
Neutral
264
-
1,583
1,855
2,135
11.6
11.8
10.3
14.7
25.7
18.0
3.9
3.4
15.8
19.1
1.1
0.9
Capital Goods
BEML
Neutral
1,679
-
6,992
4,286
5,194
7.1
8.2
42.9
58.1
39.1
28.9
3.2
2.9
7.6
8.7
1.7
1.4
Bharat Electronics
Neutral
185
-
45,393
10,258
12,470
19.6
19.5
7.3
8.6
25.3
21.5
0.5
0.4
20.4
21.9
3.9
3.2
Voltas
Neutral
623
-
20,619
6,778
8,004
9.6
11.0
17.1
22.4
36.4
27.8
8.7
7.6
17.7
19.8
2.7
2.3
BHEL
Neutral
92
-
33,887
33,200
39,167
6.8
9.5
6.2
11.2
14.9
8.2
0.7
0.7
4.6
8.0
0.6
0.5
Blue Star
Buy
701
867
6,714
5,220
6,207
6.3
6.6
16.8
22.3
41.7
31.4
8.3
7.3
19.9
23.3
1.3
1.0
CG Power and Industrial
Neutral
85
-
5,340
6,555
7,292
7.5
7.5
-
0.8
8,520.0
106.5
1.3
1.3
0.1
1.2
0.9
0.8
Solutions
Greaves Cotton
Neutral
122
-
2,971
1,778
1,993
14.7
15.1
8.1
9.1
15.0
13.4
3.4
3.2
21.8
23.6
1.4
1.3
Stock Watch
November 27, 2017
Company Name
Reco
CMP
Target
Mkt Cap
Sales ( Čcr )
OPM(%)
EPS (Č)
PER(x)
P/BV(x)
RoE(%)
EV/Sales(x)
(Č)
Price ( Č)
( Č cr )
FY18E FY19E
FY18E
FY19E
FY18E
FY19E
FY18E
FY19E
FY18E
FY19E
FY18E
FY19E
FY18E
FY19E
Capital Goods
KEC International
Accumulate
325
350
8,363
9,779
11,113
9.4
9.8
14.2
18.2
22.9
17.9
4.4
3.6
21.1
22.1
1.1
1.0
KEI Industries
Accumulate
339
380
2,653
3,001
3,391
10.0
10.0
13.0
16.1
26.0
21.0
4.7
3.9
18.2
18.7
1.1
0.9
Thermax
Neutral
1,048
-
12,492
4,125
4,747
10.3
10.8
26.7
31.5
39.3
33.3
4.4
4.0
11.2
12.0
2.8
2.4
VATech Wabag
Buy
574
681
3,135
3,867
4,126
9.6
10.0
34.9
39.8
16.5
14.4
2.7
2.3
17.7
17.5
0.8
0.8
Cement
ACC
Neutral
1,699
-
31,906
12,255
13,350
13.5
14.3
58.0
66.2
29.3
25.7
3.5
3.2
11.5
12.2
2.6
2.4
Ambuja Cements
Neutral
265
-
52,630
10,250
11,450
17.5
19.0
7.2
8.3
36.8
31.9
2.6
2.5
7.0
7.8
4.9
4.3
India Cements
Neutral
175
-
5,399
6,135
6,750
14.8
15.2
8.5
11.5
20.6
15.2
1.0
1.0
4.8
6.2
1.2
1.1
JK Cement
Neutral
1,001
-
6,995
4,150
4,775
19.2
20.0
49.0
63.5
20.4
15.8
3.2
2.8
17.0
18.5
2.1
1.8
J K Lakshmi Cement
Neutral
393
-
4,619
3,422
3,757
15.5
17.0
13.5
23.2
29.1
16.9
3.0
2.6
10.8
15.5
1.8
1.5
Orient Cement
Neutral
163
-
3,333
2,215
3,233
16.8
17.0
5.9
6.9
27.6
23.6
2.1
2.0
10.8
10.1
2.5
1.7
UltraTech Cement
Neutral
4,232
-
116,183
28,250
35,150
20.2
23.5
77.5
122.2
54.6
34.6
4.6
4.2
9.6
14.8
4.6
3.7
Construction
KNR Constructions
Neutral
277
-
3,890
1,846
2,203
14.5
14.5
12.1
13.7
22.9
20.3
1.3
1.1
17.5
16.7
2.2
1.8
Larsen & Toubro
Neutral
1,216
-
170,408
95,787
109,476
10.2
11.6
44.5
50.8
27.4
24.0
3.4
3.1
12.9
13.1
2.3
2.1
Gujarat Pipavav Port
Neutral
153
-
7,389
739
842
61.6
62.7
5.1
6.2
30.0
24.9
3.7
3.6
12.7
14.9
9.5
8.2
PNC Infratech
Neutral
188
-
4,827
2,040
2,935
13.0
13.0
6.4
9.0
29.4
20.9
0.8
0.7
9.7
12.2
2.4
1.7
Simplex Infra
Neutral
542
-
2,684
6,012
6,619
11.6
11.7
21.1
31.0
25.8
17.5
1.8
1.6
6.5
8.6
1.0
0.9
Sadbhav Engineering
Neutral
357
-
6,131
3,823
4,426
10.7
10.8
10.3
11.8
34.7
30.3
4.2
3.7
10.1
10.5
1.9
1.7
NBCC
Neutral
265
-
23,846
9,099
12,706
6.4
6.4
7.3
9.6
36.4
27.7
1.6
1.3
27.5
30.5
2.5
1.8
MEP Infra
Neutral
101
-
1,634
2,403
2,910
18.3
16.8
2.4
6.1
42.7
16.5
16.2
10.9
35.2
55.8
1.8
1.5
SIPL
Neutral
138
-
4,843
2,060
2,390
46.8
47.7
(5.8)
(3.1)
5.2
5.9
(14.2)
(2.3)
7.1
6.6
Engineers India
Neutral
185
-
12,433
1,795
2,611
21.1
22.4
5.9
8.1
31.3
22.8
2.2
2.2
12.9
16.1
5.3
3.5
Financials
Axis Bank
Accumulate
545
580
130,649
32,558
35,843
3.5
3.2
27.8
41.0
19.6
13.3
2.1
1.9
11.4
14.9
-
-
Bank of Baroda
Neutral
177
-
40,749
22,533
26,079
2.4
2.4
12.0
20.9
14.7
8.5
1.0
0.9
6.6
11.0
-
-
Canara Bank
Neutral
390
-
23,300
17,925
20,235
2.0
2.1
18.5
36.5
21.1
10.7
0.8
0.8
3.4
6.2
-
-
Can Fin Homes
Neutral
458
-
6,100
586
741
3.5
3.5
107.8
141.0
4.3
3.3
0.9
0.8
24.1
25.6
-
-
Cholamandalam Inv. &
Neutral
1,271
-
19,866
2,826
3,307
6.3
6.3
53.7
64.6
23.7
19.7
4.0
3.4
18.3
18.9
-
-
Fin. Co.
Dewan Housing Finance Buy
618
712
19,381
2,676
3,383
2.4
2.7
37.4
49.7
16.5
12.4
2.2
1.9
13.8
16.2
-
-
Equitas Holdings
Buy
146
235
4,958
1,125
1,380
9.6
9.8
1.5
6.0
97.4
24.3
2.2
2.1
2.4
8.2
-
-
Federal Bank
Accumulate
112
125
22,025
4,896
5,930
2.8
3.1
5.4
7.6
20.9
14.8
1.8
1.6
8.5
11.0
-
-
Stock Watch
November 27, 2017
Company Name
Reco
CMP
Target
Mkt Cap
Sales ( Čcr )
OPM(%)
EPS (Č)
PER(x)
P/BV(x)
RoE(%)
EV/Sales(x)
(Č)
Price ( Č)
( Č cr )
FY18E FY19E
FY18E
FY19E
FY18E
FY19E
FY18E
FY19E
FY18E
FY19E
FY18E
FY19E
FY18E
FY19E
Financials
GIC Housing
Buy
425
655
2,290
376
477
3.6
3.7
33.0
40.0
12.9
10.6
2.3
2.0
20.0
23.0
-
-
HDFC Bank
Neutral
1,851
-
478,691
55,236
63,253
4.5
4.4
68.9
82.4
26.9
22.5
4.7
3.9
18.7
18.5
-
-
ICICI Bank
Neutral
317
-
203,518
42,361
51,378
3.6
3.9
18.4
25.7
17.3
12.3
1.9
1.8
11.3
15.0
-
-
Karur Vysya Bank
Buy
121
180
7,288
3,289
3,630
3.7
3.9
10.8
14.1
11.1
8.6
1.3
1.2
12.5
14.7
-
-
LIC Housing Finance
Accumulate
598
630
30,186
4,895
6,332
3.4
3.7
50.7
66.8
11.8
9.0
2.4
1.9
21.7
23.8
-
-
Punjab Natl.Bank
Neutral
186
-
39,591
23,708
25,758
2.1
2.1
5.9
16.4
31.7
11.3
0.9
0.9
3.0
8.3
-
-
RBL Bank
Neutral
513
-
21,344
2,309
2,888
2.6
2.5
16.4
19.1
31.3
26.9
3.9
3.5
13.3
13.8
-
-
Repco Home Finance
Buy
630
825
3,940
496
597
4.4
4.2
38.5
48.7
16.4
12.9
2.9
2.4
19.6
20.6
-
-
South Ind.Bank
Neutral
31
-
5,670
3,195
3,567
3.0
3.1
3.0
3.8
10.4
8.2
1.0
0.9
10.5
11.9
-
-
St Bk of India
Neutral
332
-
286,800
105,827
121,056
2.4
2.5
16.1
25.6
20.7
13.0
1.6
1.5
6.6
9.9
-
-
Union Bank
Neutral
168
-
12,179
14,650
16,225
2.3
2.3
23.1
32.5
7.3
5.2
0.6
0.5
7.1
9.2
-
-
Yes Bank
Neutral
313
-
71,760
11,088
13,138
3.0
2.9
84.0
99.3
3.7
3.2
0.6
0.5
16.3
16.8
-
-
FMCG
Akzo Nobel India
Neutral
1,821
-
8,734
3,164
3,607
13.8
13.7
58.6
67.9
31.1
26.8
7.6
6.7
24.5
25.1
2.6
2.3
Asian Paints
Neutral
1,160
-
111,272
17,603
20,615
18.6
18.6
2,128.9
2,543.3
0.5
0.5
11.5
9.7
28.0
28.9
6.1
5.2
Britannia
Neutral
4,742
-
56,934
9,690
11,278
14.8
15.4
84.0
101.0
56.5
47.0
20.6
16.4
40.6
39.0
5.8
5.0
Colgate
Neutral
1,053
-
28,626
4,420
5,074
24.9
25.3
28.6
32.8
36.8
32.1
14.5
11.7
43.8
40.5
6.2
5.4
Dabur India
Neutral
344
-
60,570
8,346
9,344
19.6
19.9
7.8
9.0
44.1
38.2
8.9
8.0
25.2
24.8
6.9
6.0
GlaxoSmith Con*
Neutral
6,041
-
25,404
5,072
5,760
18.2
18.4
176.3
199.2
34.3
30.3
7.3
6.6
21.2
21.7
4.3
3.8
Godrej Consumer
Neutral
970
-
66,069
10,171
11,682
20.8
21.5
21.7
27.1
44.7
35.8
10.1
8.6
22.3
23.4
6.6
5.7
HUL
Neutral
1,267
-
274,175
37,077
41,508
20.3
21.8
5,189.9
6,318.5
0.2
0.2
38.6
33.0
74.8
82.0
7.2
6.5
ITC
Neutral
260
-
317,250
44,588
49,853
37.0
37.3
9.6
11.0
27.1
23.7
6.7
6.3
25.1
27.3
6.6
5.9
Marico
Neutral
309
-
39,820
6,788
7,766
18.5
19.2
7.1
8.5
43.5
36.3
15.2
13.0
36.9
38.0
5.7
5.0
Nestle*
Neutral
7,510
-
72,409
10,083
11,182
20.0
20.9
119.7
141.3
62.7
53.2
221.1
202.1
36.7
39.8
6.9
6.1
Tata Global
Neutral
279
-
17,590
7,121
7,641
11.9
12.3
6.9
8.0
40.4
34.8
2.7
2.6
6.8
7.2
2.3
2.1
Procter & Gamble
Neutral
9,180
-
29,799
3,034
3,579
27.1
27.7
167.7
198.8
54.7
46.2
14.7
12.7
28.8
29.5
9.2
7.7
Hygiene
IT
HCL Tech^
Buy
859
1,014
122,507
50,009
54,608
22.1
22.1
62.8
67.6
13.7
12.7
3.1
2.6
22.4
20.6
2.1
1.8
Infosys
Accumulate
1,010
1,120
231,985
70,333
75,960
26.0
26.0
61.7
65.9
16.4
15.3
3.1
2.9
18.9
18.7
2.7
2.4
TCS
Reduce
2,689
2,442
514,704
123,384
134,488
26.1
26.1
133.2
143.7
20.2
18.7
5.6
5.2
27.6
27.8
3.8
3.5
Tech Mahindra
Accumulate
494
526
48,199
30,545
32,988
15.0
15.0
35.2
37.6
14.0
13.1
2.4
2.2
16.8
16.2
1.4
1.2
Stock Watch
November 27, 2017
Company Name
Reco
CMP
Target
Mkt Cap
Sales ( Čcr )
OPM(%)
EPS (Č)
PER(x)
P/BV(x)
RoE(%)
EV/Sales(x)
(Č)
Price ( Č)
( Č cr )
FY18E FY19E
FY18E
FY19E
FY18E
FY19E
FY18E
FY19E
FY18E
FY19E
FY18E
FY19E
FY18E
FY19E
IT
Wipro
Neutral
293
-
142,375
54,164
56,544
22.3
22.3
18.8
19.5
15.6
15.0
2.5
2.2
15.0
13.6
1.9
1.6
Media
D B Corp
Neutral
366
-
6,737
2,404
2,625
30.5
31.5
23.7
26.9
15.5
13.6
3.6
3.1
23.5
22.8
2.6
2.4
HT Media
Neutral
101
-
2,347
2,589
2,830
15.1
15.4
8.3
10.9
12.2
9.3
1.0
0.9
8.4
10.4
0.5
0.3
Jagran Prakashan
Buy
165
225
5,148
2,541
2,835
28.5
28.7
12.7
14.1
13.0
11.7
2.7
2.3
21.3
21.4
1.9
1.6
Sun TV Network
Neutral
876
-
34,518
3,238
3,789
51.9
55.1
30.9
38.0
28.4
23.1
8.1
7.1
30.0
31.0
10.2
8.6
Hindustan Media
Neutral
249
-
1,825
1,002
1,074
23.3
23.5
29.2
33.8
8.5
7.4
1.3
1.1
15.6
15.4
0.8
0.6
Ventures
TV Today Network
Accumulate
386
435
2,304
667
727
27.7
27.7
18.6
20.1
20.8
19.3
3.2
3.3
15.6
17.3
3.0
2.8
Music Broadcast Limited Buy
376
434
2,145
271
317
91.0
109.0
6.0
10.0
62.7
37.6
3.9
3.6
6.5
9.3
7.5
6.2
Metals & Mining
Coal India
Neutral
271
-
168,283
82,301
91,235
17.0
18.0
17.1
20.5
15.9
13.2
3.0
2.8
45.0
55.0
1.7
1.5
Hind. Zinc
Neutral
309
-
130,710
22,108
24,555
57.0
58.0
22.1
26.3
14.0
11.8
4.5
3.7
32.0
35.0
4.9
4.1
Hindalco
Neutral
252
-
56,512
102,350
105,355
13.5
14.5
21.5
24.5
11.7
10.3
1.6
1.4
15.0
15.2
1.1
1.1
JSW Steel
Neutral
265
-
64,105
64,500
68,245
21.1
21.5
20.1
21.2
13.2
12.5
2.4
2.1
-
-
1.7
1.6
NMDC
Neutral
127
-
40,118
10,209
11,450
47.0
48.0
11.1
12.1
11.4
10.5
1.6
1.5
-
-
3.4
3.1
SAIL
Neutral
82
-
34,032
54,100
63,555
3.0
10.0
(10.0)
1.5
54.9
1.1
1.1
-
-
1.6
1.4
Vedanta
Neutral
306
-
113,709
81,206
87,345
28.0
29.0
26.5
33.5
11.5
9.1
2.6
2.3
-
-
2.1
1.8
Tata Steel
Neutral
708
-
68,738
121,445
126,500
16.2
17.2
65.4
81.3
10.8
8.7
1.7
1.5
-
-
1.1
1.0
Oil & Gas
GAIL
Neutral
471
-
79,736
53,115
52,344
14.2
15.3
30.0
31.1
15.7
15.2
2.0
1.8
-
-
1.2
1.2
ONGC
Neutral
181
-
232,153
83,111
84,934
44.2
44.9
16.4
16.9
11.0
10.7
1.3
1.2
-
-
2.7
2.6
Indian Oil Corp
Neutral
395
-
191,808
396,116
432,560
8.5
8.8
40.1
42.2
9.9
9.4
1.7
1.5
-
-
0.6
0.6
Reliance Industries
Neutral
950
-
617,536
257,711
267,438
17.0
18.2
89.1
89.5
10.7
10.6
1.0
0.9
-
-
2.1
2.0
Pharmaceuticals
Alembic Pharma
Buy
518
600
9,761
3,346
3,915
19.6
19.2
21.0
23.9
24.7
21.7
4.4
3.7
19.1
18.4
2.9
2.5
Alkem Laboratories Ltd
Accumulate
1,987
2,125
23,758
6,320
7,341
17.5
19.8
72.7
96.6
27.3
20.6
4.8
4.1
16.7
18.7
3.7
3.1
Aurobindo Pharma
Buy
715
823
41,864
17,086
19,478
22.1
22.0
44.7
51.4
16.0
13.9
3.5
2.9
24.7
22.7
2.6
2.2
Aventis*
Neutral
4,450
-
10,248
2,411
2,698
18.8
18.8
151.6
163.9
29.4
27.2
4.6
3.7
25.4
27.5
3.8
3.2
Cadila Healthcare
Reduce
446
411
45,685
11,365
12,926
20.0
20.0
18.4
20.5
24.3
21.8
5.3
4.4
24.3
22.2
4.1
3.6
Cipla
Sell
614
462
49,452
16,163
18,711
16.6
16.9
20.7
24.3
29.7
25.3
3.5
3.1
12.6
13.1
3.2
2.7
Dr Reddy's
Reduce
2,299
2,040
38,118
13,734
15,548
17.7
20.2
69.9
102.0
32.9
22.5
2.9
2.7
9.2
12.4
3.0
2.6
GSK Pharma*
Sell
2,485
2,000
21,049
2,968
3,324
13.8
15.9
37.8
46.3
65.7
53.7
11.5
12.6
16.7
22.4
6.9
6.3
Indoco Remedies
Sell
293
136
2,700
1,114
1,297
9.9
13.9
5.6
11.4
52.3
25.7
4.0
3.5
7.7
14.5
2.7
2.3
Stock Watch
November 27, 2017
Company Name
Reco
CMP
Target
Mkt Cap
Sales ( Čcr )
OPM(%)
EPS (Č)
PER(x)
P/BV(x)
RoE(%)
EV/Sales(x)
(Č)
Price ( Č)
( Č cr )
FY18E FY19E
FY18E
FY19E
FY18E
FY19E
FY18E
FY19E
FY18E
FY19E
FY18E
FY19E
FY18E
FY19E
Pharmaceuticals
Ipca labs
Neutral
533
-
6,725
3,593
4,022
14.5
15.5
19.4
25.2
27.5
21.2
2.5
2.3
9.5
11.2
1.9
1.7
Lupin
Buy
830
1,091
37,513
16,240
18,562
21.3
21.7
42.5
49.6
19.5
16.7
2.5
2.2
13.3
13.7
2.4
2.0
Natco Pharma
Accumulate
924
1,057
16,127
1,886
2,016
32.3
29.5
23.2
22.0
39.9
41.9
8.4
7.4
20.9
17.6
8.4
7.8
Sun Pharma
Accumulate
549
615
131,611
28,312
31,826
20.7
22.4
18.5
22.3
29.7
24.6
3.4
3.0
11.5
14.0
4.3
3.7
Syngene International
Accumulate
527
556
10,539
1,394
1,818
33.0
36.0
15.8
20.6
33.3
25.6
6.2
5.1
18.6
20.0
7.5
5.8
Power
Tata Power
Neutral
94
-
25,371
32,547
33,806
20.5
20.5
4.7
5.4
20.0
17.5
1.9
1.7
10.5
10.5
1.8
1.7
NTPC
Neutral
180
-
148,748
86,070
101,246
28.3
30.7
12.9
16.2
14.0
11.1
1.4
1.3
10.6
12.4
3.1
2.8
Power Grid
Accumulate
211
223
110,439
29,183
32,946
89.7
90.0
18.0
20.8
11.8
10.2
2.0
1.7
17.7
18.2
7.7
7.2
Real Estate
Prestige Estate
Neutral
315
-
11,809
4,607
5,146
21.0
22.2
7.9
9.8
39.9
32.1
2.5
2.3
10.3
12.0
3.7
3.4
MLIFE
Buy
449
522
2,305
487
590
12.3
17.8
21.0
31.2
21.4
14.4
1.1
1.1
5.2
7.4
3.4
2.8
Telecom
Bharti Airtel
Neutral
496
-
198,391
97,903
105,233
36.0
36.3
9.3
11.1
53.4
44.9
2.6
2.4
5.0
5.6
3.0
2.7
Idea Cellular
Neutral
95
-
34,143
35,012
37,689
27.1
27.7
(4.4)
(2.7)
1.5
1.5
(6.8)
(4.6)
2.3
2.1
zOthers
Abbott India
Neutral
4,987
-
10,598
3,244
3,723
14.9
16.1
167.5
209.4
29.8
23.8
6.6
5.5
23.7
24.8
2.9
2.5
Asian Granito
Buy
494
570
1,486
1,169
1,286
12.5
12.5
16.0
19.7
30.9
25.1
3.3
2.9
10.7
11.6
1.5
1.3
Bajaj Electricals
Neutral
474
-
4,822
4,646
5,301
6.7
7.6
16.1
22.3
29.5
21.3
4.8
4.1
16.4
19.2
1.0
0.9
Banco Products (India)
Neutral
244
-
1,746
1,530
1,695
13.2
12.7
19.0
20.0
12.9
12.2
2.1
1.8
0.2
0.2
1.1
117.2
Coffee Day Enterprises
Neutral
230
-
4,738
3,494
3,913
17.4
18.0
4.8
5.7
-
40.4
2.0
1.9
-
0.1
1.8
1.6
Ltd
Elecon Engineering
Neutral
78
-
872
171
201
15.0
16.2
36.0
43.0
2.2
1.8
0.2
0.2
0.1
0.1
4.5
3.8
Garware Wall Ropes
Neutral
917
-
2,006
928
1,003
15.2
15.2
39.4
43.2
23.2
21.2
3.8
3.3
16.5
15.4
2.0
1.8
Goodyear India*
Neutral
860
-
1,984
1,717
1,866
11.8
12.3
47.9
49.8
17.9
17.3
2.8
2.4
15.6
15.7
0.9
121.9
Hitachi
Neutral
2,515
-
6,839
2,355
2,715
10.3
10.8
49.0
60.9
51.3
41.3
12.0
9.5
0.2
0.2
2.9
2.5
HSIL
Neutral
529
-
3,826
2,240
2,670
14.6
15.0
17.0
22.0
31.1
24.1
2.6
2.4
0.1
0.1
1.9
1.6
Interglobe Aviation
Neutral
1,180
-
45,366
22,570
27,955
14.2
15.0
63.6
81.8
18.6
14.4
9.8
8.3
0.5
0.6
1.7
1.3
Jyothy Laboratories
Neutral
377
-
6,854
1,781
2,044
14.1
15.0
9.4
10.5
40.3
35.9
8.6
8.1
0.2
0.2
4.1
3.5
Linc Pen & Plastics
Neutral
299
-
442
420
462
9.3
9.3
15.3
17.1
19.6
17.5
3.3
3.4
16.9
19.5
1.1
1.0
M M Forgings
Neutral
894
-
1,079
542
642
20.1
21.0
41.6
56.8
21.5
15.7
3.0
2.5
0.1
0.2
2.4
2.1
Mirza International
Neutral
163
-
1,960
1,148
1,285
18.0
18.0
8.0
9.4
20.3
17.4
3.4
2.8
16.3
16.1
1.9
1.6
Navkar Corporation
Buy
191
265
2,869
561
617
41.5
41.5
11.5
12.7
16.6
15.0
1.7
1.6
10.5
10.4
5.8
5.0
Nilkamal
Neutral
1,680
-
2,507
2,317
2,525
11.4
11.1
96.0
105.0
17.5
16.0
3.0
2.6
0.2
0.2
1.1
1.0
Stock Watch
November 27, 2017
Company Name
Reco
CMP
Target Mkt Cap
Sales ( Čcr )
OPM(%)
EPS (Č)
PER(x)
P/BV(x)
RoE(%)
EV/Sales(x)
(Č)
Price ( Č)
( Č cr )
FY18E FY19E FY18E FY19E FY18E FY19E FY18E FY19E FY18E FY19E FY18E FY19E FY18E FY19E
zOthers
Parag Milk Foods
Neutral
240
-
2,019
1,987
2,379
7.6
9.0
12.4
18.3
19.4
13.1
2.7
2.4
8.2
13.2
1.1
1.0
Radico Khaitan
Neutral
279
-
3,720
1,811
1,992
13.2
13.2
8.1
8.8
34.5
31.7
3.5
3.8
10.1
12.0
2.4
2.2
Relaxo Footwears
Neutral
600
-
7,216
1,981
2,310
13.7
14.5
12.0
15.5
50.0
38.7
9.7
7.9
0.2
0.2
3.7
3.2
Siyaram Silk Mills
Accumulate
585
650
2,742
1,769
1,981
12.7
12.7
22.6
26.2
25.9
22.3
4.0
3.5
15.5
15.5
1.7
1.5
Styrolution ABS India* Neutral
996
-
1,751
1,800
1,980
8.0
8.1
42.0
46.2
23.7
21.6
2.7
2.4
0.1
0.1
1.1
1.0
Surya Roshni
Neutral
388
-
1,700
4,870
5,320
7.7
7.8
22.8
28.1
17.1
13.8
2.3
2.0
0.1
0.1
0.6
0.5
TVS Srichakra
Neutral
3,319
-
2,542
2,729
2,893
12.7
12.5
248.5
265.0
13.4
12.5
3.8
3.1
0.3
0.3
0.9
0.9
Visaka Industries
Neutral
598
-
949
1,104
1,214
12.1
12.6
31.0
37.9
19.3
15.8
2.4
2.1
0.1
0.1
1.1
1.0
VIP Industries
Neutral
343
-
4,846
1,450
1,693
10.4
10.5
6.5
7.8
52.4
43.9
11.1
9.7
21.1
22.1
3.3
2.8
Navin Fluorine
Neutral
699
-
3,447
945
1,154
22.4
22.6
28.7
34.8
24.4
20.1
4.0
3.4
-
-
3.2
2.5
Source: Company, Angel Research; Note: *December year end; #September year end; &October year end; Price as on November 24, 2017
Market Outlook
November 27, 2017
Research Team Tel: 022 - 39357800
DISCLAIMER
Angel Broking Private Limited (hereinafter referred to as “Angel”) is a registered Member of National Stock Exchange of India
Limited,Bombay Stock Exchange Limited and Metropolitan Stock Exchange Limited. It is also registered as a Depository Participant with
CDSL and Portfolio Manager with SEBI. It also has registration with AMFI as a Mutual Fund Distributor. Angel Broking Private Limited is a
registered entity with SEBI for Research Analyst in terms of SEBI (Research Analyst) Regulations, 2014 vide registration number
INH000000164. Angel or its associates has not been debarred/ suspended by SEBI or any other regulatory authority for accessing
/dealing in securities Market. Angel or its associates/analyst has not received any compensation / managed or
co-managed public offering of securities of the company covered by Analyst during the past twelve months.
This document is solely for the personal information of the recipient, and must not be singularly used as the basis of any investment
decision. Nothing in this document should be construed as investment or financial advice. Each recipient of this document should make
such investigations as they deem necessary to arrive at an independent evaluation of an investment in the securities of the companies
referred to in this document (including the merits and risks involved), and should consult their own advisors to determine the merits and
risks of such an investment.
Reports based on technical and derivative analysis center on studying charts of a stock's price movement, outstanding positions and
trading volume, as opposed to focusing on a company's fundamentals and, as such, may not match with a report on a company's
fundamentals. Investors are advised to refer the Fundamental and Technical Research Reports available on our website to evaluate the
contrary view, if any.
The information in this document has been printed on the basis of publicly available information, internal data and other reliable
sources believed to be true, but we do not represent that it is accurate or complete and it should not be relied on as such, as this
document is for general guidance only. Angel Broking Pvt. Limited or any of its affiliates/ group companies shall not be in any way
responsible for any loss or damage that may arise to any person from any inadvertent error in the information contained in this report.
Angel Broking Pvt. Limited has not independently verified all the information contained within this document. Accordingly, we cannot
testify, nor make any representation or warranty, express or implied, to the accuracy, contents or data contained within this document.
While Angel Broking Pvt. Limited endeavors to update on a reasonable basis the information discussed in this material, there may be
regulatory, compliance, or other reasons that prevent us from doing so.
This document is being supplied to you solely for your information, and its contents, information or data may not be reproduced,
redistributed or passed on, directly or indirectly.
Neither Angel Broking Pvt. Limited, nor its directors, employees or affiliates shall be liable for any loss or damage that may arise from
or in connection with the use of this information.